GigaPlumb Analysis Features
GigaPlumb features a wide variety of analysis tools to help you make sense the oceans of raw sales and inventory data.
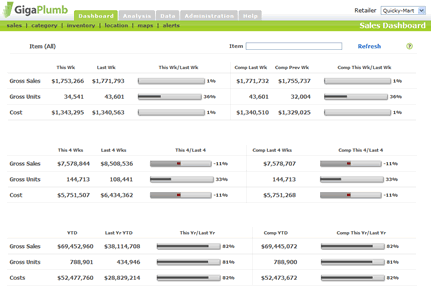
Dashboards

GigaPlumb sales, inventory, and location dashboards aggregate large amounts of data and give you a high-level overview.
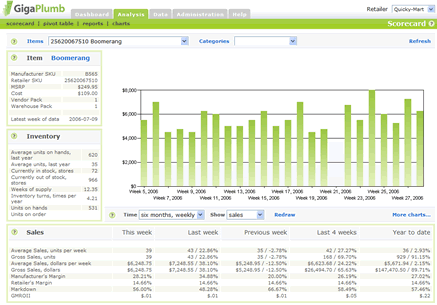
Scorecards

Our scorecards give you instant access to essential information about every item or category.
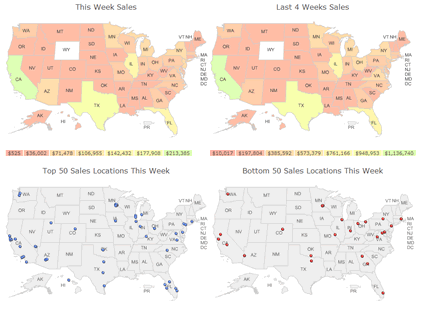
Maps

GigaPlumb maps give you a overall view of sales or inventory and plot them against demographic information.
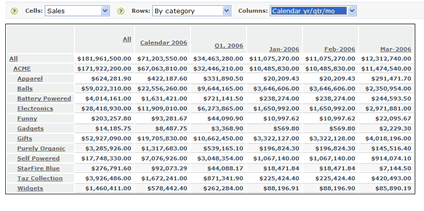
Dynamic Pivot Table

The “pivot table on steroids”, allows you to slice and dice your data in a myriad of ways.
Plus, we have dozens of reports and charts, all exportable as PDF, Excel, and flat file formats.
